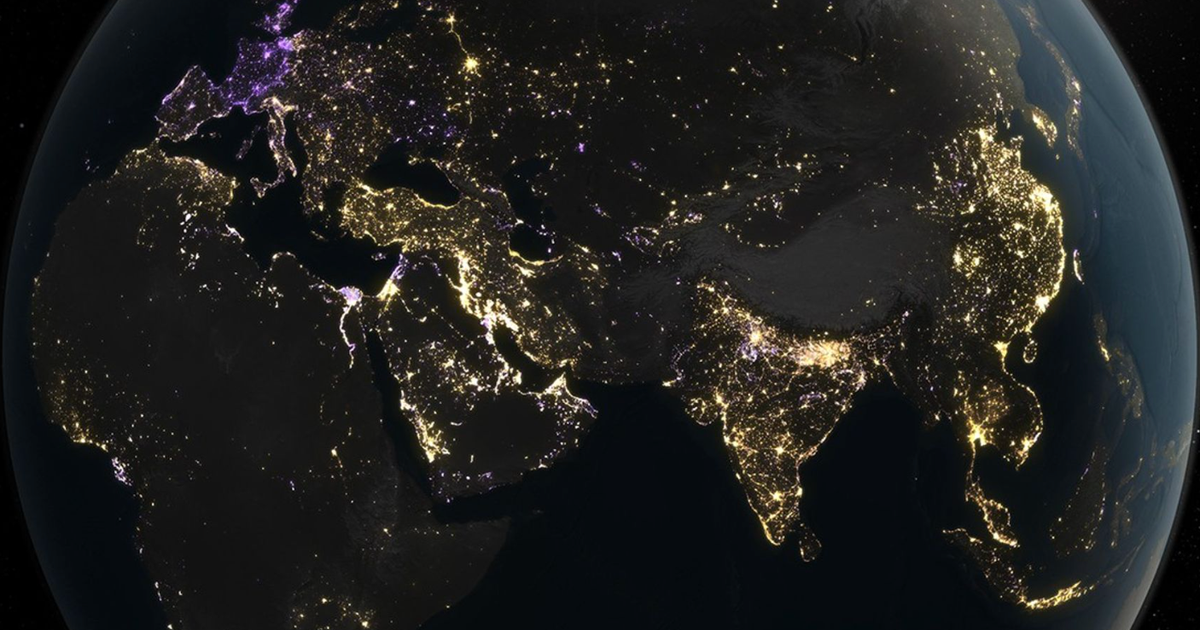
SouthernWorldwide.com – New maps from NASA, compiled using nearly a decade of data, reveal significant shifts in the use of artificial light across Earth at night.
These maps were created by NASA researchers who analyzed data from the agency’s “Black Marble” program. This program employs a specialized sensor designed to capture low-light imagery of Earth during nighttime hours. The data used for this comprehensive analysis was gathered by three different satellites over a period spanning from 2014 to 2022.
Scientists initially anticipated a steady increase in artificial light usage over the years. However, the findings presented a more complex picture than a simple, uniform rise. NASA stated in a news release that the patterns of light radiance observed were “much more nuanced.”
The researchers noted that the analysis illustrates a dynamic global landscape. It reflects industrial growth and decline, construction activities, and instances of power outages. Additionally, it captures more gradual changes, such as the impact of policy-driven upgrades to lighting systems.
This image represents the Black Marble data collected by NASA, with purple indicating areas where light has dimmed and gold showing areas where it has brightened.
Credit: NASA Earth Observatory/Michala Garrison
The study revealed that every location observed by the sensors experienced distinct changes throughout the nine-year data collection period. Over these years, artificial light intensity increased by 34%, while a decrease in lighting, or dimming, accounted for 18% of the changes. Both increases and decreases in lighting “markedly intensified over the past decade,” according to the researchers’ findings published in the academic journal Nature.
Read more : SpaceX launches cargo ship to International Space Station
The researchers highlighted the significance of these observations, stating, “This evidence of increasing volatility in human night-time activity provides an important dynamic dimension for understanding urban evolution, energy transitions, policy impacts and ecological consequences of rapidly changing illuminated nights.”
In the United States, cities on the West Coast generally became brighter, correlating with population growth. Conversely, the East Coast exhibited more dimming. The researchers attributed this dimming trend to the widespread adoption of energy-efficient light bulbs and broader economic shifts.
This analysis of the Black Marble data from NASA shows purple for dimming areas and gold for brightening areas.
Credit: NASA Earth Observatory/Michala Garrison
Globally, regions such as China and northern India experienced an increase in nighttime brightness, largely driven by urban expansion. In contrast, Europe showed a pattern of dimming, likely due to energy conservation efforts. A notable sharp decrease in lighting was observed across Europe in 2022, following the energy crisis that emerged after the war in Ukraine.
The researchers concluded their paper by stating, “This global, high-resolution analysis … refines and expands our understanding of how humanity is altering the night environment.” They further elaborated, “Our findings show that the human light footprint is not a universally expanding entity but a dynamic system, characterized by the pervasive coexistence of brightening and dimming.”